09/Full-stack / Analytics/2026/Internal
ReadStage (PaperTrack)
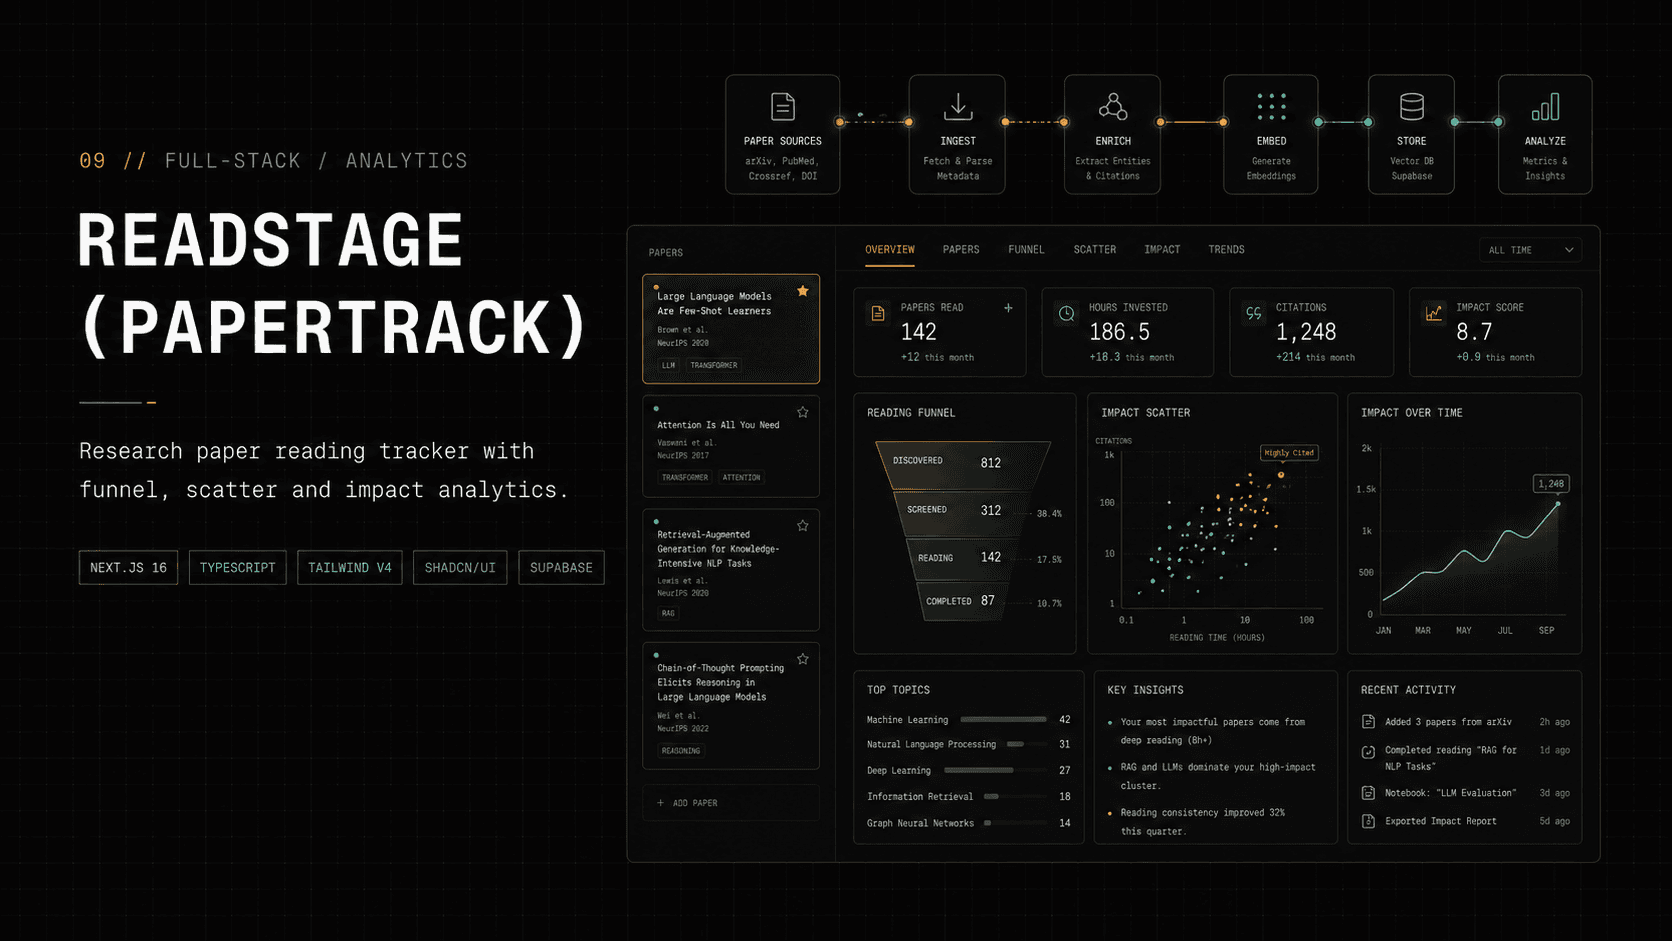
Research paper reading tracker with funnel, scatter and impact analytics.
// Overview
Next.js 16 + Supabase app for tracking research papers across reading stages. Multi-select filters by stage, domain, impact and date range. Recharts dashboard with funnel, scatter and stacked bar visualizations.
// Problem
Reading lists rot in spreadsheets and Notion pages. No way to see where papers stall or which domains you actually finish.
// Approach
01Postgres schema with enum-typed reading stages so analytics queries stay clean.
02Server/client Supabase split via separate clients in lib/supabase/.
03Responsive dual layout: desktop table view, mobile card view, same data store.
04Analytics layer transforms rows once into chart-ready shapes — no chart-side logic.
// Outcome
›Single dashboard surfaces stalled papers and domain bias
›Drop-in seed migrations for demo data
// Stack
Next.js 16TypeScriptTailwind v4shadcn/uiSupabaseRecharts
Next case →